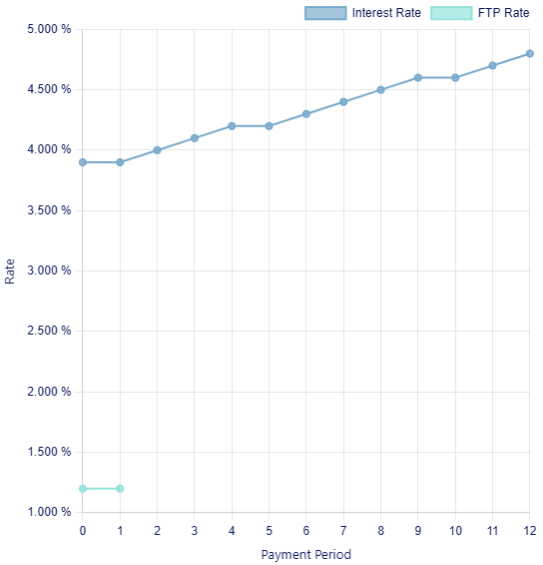
You can see a visual representation of how an index changes for a simulation in the Simulations graph on the Pricing Opportunity page.
Select a row in the Simulations table, and then view the graph.