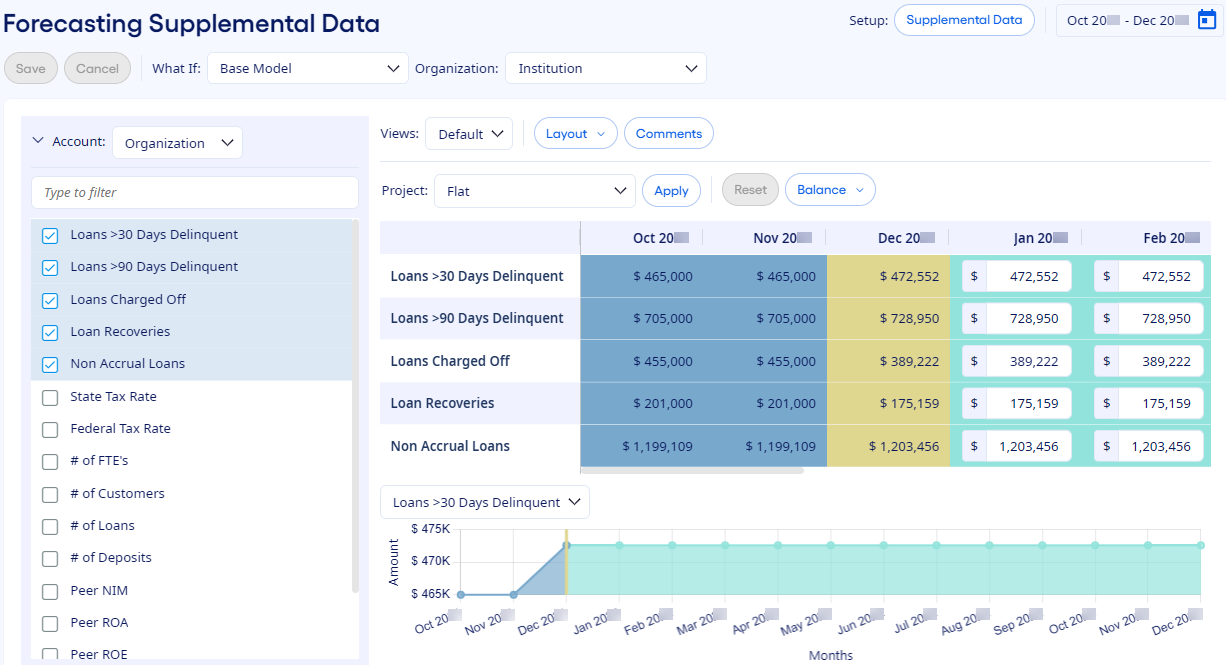
You can project items such as tax
rates, delinquencies, charge-offs, recoveries, and all other statistical data, on the Forecasting Supplemental Data page.
-
Select from the menu.
The Forecasting Supplemental Data page opens.
-
Select a What If model from the
drop-down list.
-
Select an organization from the Organization drop-down
list.
-
Select either Organization or Global from
the Account drop-down list.
You can uniquely project organization data items at each organization or
apply global data items to all organizations.
-
Use the expand option next to Account to select supplemental
data items to forecast.
-
Select the time frames to show while forecasting in the Select
Time Frames dialog box, and then select Apply.
-
Select an option from the View drop-down list.
-
Select a Layout option to change how the data appears in the
grid area.
-
Select Comments to view and enter a narrative for the projected
values.
The Comments option shows the number of comments if any are
available to view.
-
Enter the projected values manually or select an option from
Project to apply forecasting techniques to the projected time
frames.
When forecasting supplemental data, you can use a combination of manual
and Project option techniques.
Use Reset to undo recent changes incrementally back to
the point of the last time you saved the forecasting data. Use
Balance to run the balancing routine manually for the current
organization or all organizations.
Use Supplemental Data to leave the Forecasting Supplemental Data page in its current state without
saving and go directly to the Supplemental Data setup
page. On the Supplemental Data page, you can view data
setup information and make setup changes. To continue your work in Forecasting Supplemental Data, select Forecasting Supplemental
Data.