CECL Analysis Summary
On the Analysis tab on the Current Expected Credit Loss (CECL) Summary page, you can access tools and information designed to help you analyze your expected and discounted loan losses.
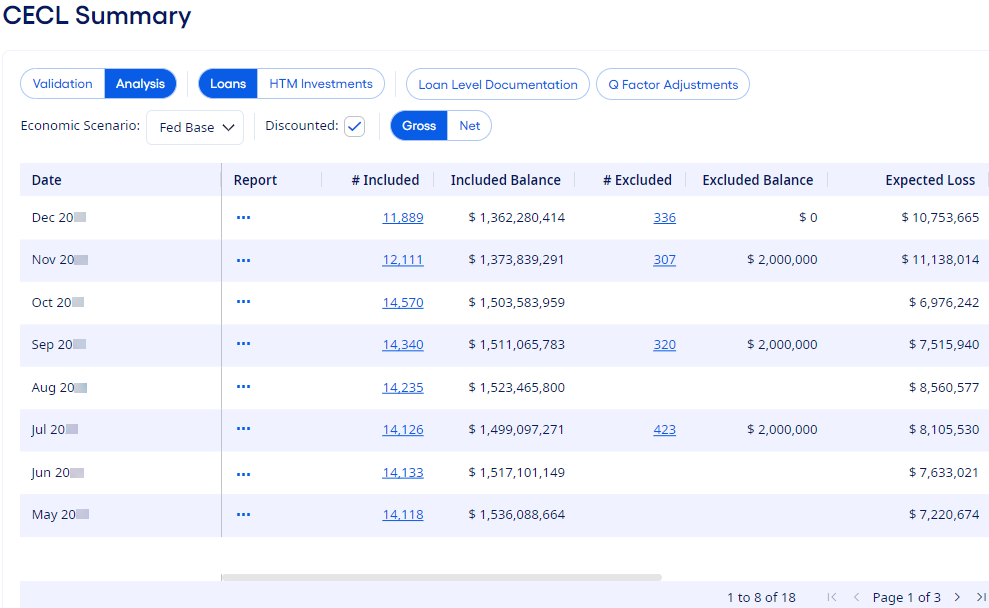
CECL Summary Controls
- Loans/Unfunded Commitments/HTM Investments
- Use this option to switch between the loan, unfunded commitments, or HTM investment results, reports, and links.
- Organization
- Use this option to select an organization to analyze from the drop-down list. This option is only available if your institution is licensed as a holding company.
- Economic Scenario
-
Use this option on the Analysis tab to view results for several economic scenarios:
- Fed Base - Represents the Federal Reserve's base economic forecast.
- Fed Severe - Represents the Federal Reserve's forecast if current economic conditions deteriorate.
- Base
- Adverse
- Expansion
- Custom - Users with the CECL A&R-Enhanced license can receive and review custom economic scenarios from Deep Future Analytics (DFA).
- Discounted
- Use this option to control whether discounted results appear. If the option is selected, then the results show the present value of the estimated CECL loss forecast. The discounted cash flow (DCF) option is allowed under the Financial Accounting Standards Board (FASB) CECL regulations. The losses are estimated to occur in future time frames and CECL regulations allow institutions to set reserves equal to the present value of such losses. Expected losses are discounted using the effective interest rates of the individual loan.
- Gross/Net
- Use this option to control whether gross or net results appear in the grid. This option is only available for loans.
CECL Summary Analysis Tools
- Loan Level Documentation
-
Use this option with the CECL Analysis license to request Loan Level Documentation reports (also known as Blue Sheets or Audit Reports) at the instrument level when the Loans option is selected. Each resulting Excel® report details the calculations for the current month for a selected account, model type, and economic scenario. This information helps clarify how the expected loss is determined for any given loan record.
You can submit up to eight requests at one time. Loan level documentation requests and investment level documentation requests cannot be submitted together.
The Loan Level Documentation link is visible from any of the Analysis page levels including the CECL Summary, CECL Categories, and CECL Details pages. The current month must be in a completed state with analysis results back from DFA.
- Investment Level Documentation
-
Use this option with the CECL Analysis license to request Investment Level Documentation reports at the instrument level when the HTM Investments option is selected. Each resulting Excel® report details the calculations for the current month for a selected account, model type, and economic scenario. This information helps clarify how the expected loss is determined for any given investment record.
You can submit up to eight requests at one time. Loan level documentation requests and investment level documentation requests cannot be submitted together.
The Investment Level Documentation link is visible from any of the Analysis page levels including the CECL Summary, CECL Categories, and CECL Details pages. The current month must be in a completed state with analysis results back from DFA.
- Q Factor Adjustments
-
Use this option for Q Factor adjustments. Q Factors are qualitative factor coefficients that you can apply to all your accounts in a group so that you can weigh them. Use this tool to justify why loan loss reserves are at the current level and to model the effects of adjustments to reserves based on multiple factors.
When you have the necessary permissions to edit or view Q Factor Adjustments, a Q Factor Adjustments link appears on the Analysis tab on the CECL Summary page. The link opens the Q Factor Adjustments setup page.
You can export CECL data to a .csv file or to Excel®. Right-click in the grid, and then select either or . The file is downloaded immediately to your computer.