CECL Economic Scenarios
Each February, the Federal Reserve Board (FRB) releases the Dodd-Frank Act Stress Testing (DFAST) scenarios for the Current Expected Credit Loss (CECL) model.
The Challenge for Lenders
The scenarios begin in January of that year and project 27 months forward. Although the scenarios are used for many purposes, they are primarily intended for stress testing where the lender's portfolio forecast is compared between the FRB Severe and FRB Base scenarios. The challenge for lenders using these scenarios for other purposes is that they are released annually and can become outdated quickly.
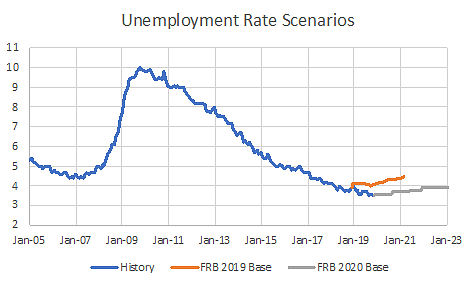
The FRB Base scenario tends to be a pessimistic scenario given the stress testing focus. The Unemployment Rate Scenarios graph shows the history of the unemployment rate and the 2019 and 2020 FRB Base scenarios. The scenarios trend upward from the last available data at the time the scenarios were created.
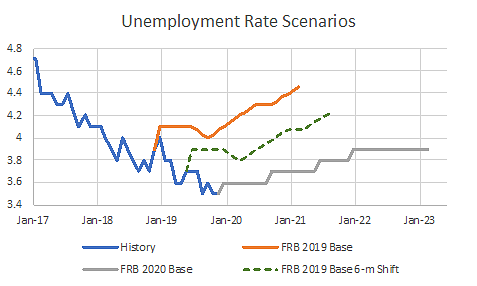
The Closer View of Unemployment Rate Scenarios graph shows a closer view of the same scenarios in the Unemployment Rate Scenarios graph. By July 2019, the FRB Base scenario is 40 basis points higher than actual conditions: 4.1 percent unemployment in the FRB Base scenario versus 3.7 percent in the actual environment.
If you create a forecast starting in July 2019, then the scenario prior to that month is ignored and only the rising unemployment rate environment is considered. After six months of unemployment rate improvement, the loss forecast is worse because a pessimistic part of the FRB Base scenario is used.
Based on the graph, if the economy falls into recession, then the forecast is low using the FRB Base scenario because it starts from a prerecession point in time.
The FRB scenarios need adjustments so that they are updated for current environments. No adjustment is perfect. If a recession begins, then, from that point, an economist creates a different scenario than the FRB Base scenario. However, some simple changes to the FRB scenarios to make them more current.
The Shift-and-Apply Changes Approach
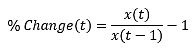
The shift-and-apply-changes approach is used to compute the monthly changes implied in the FRB scenario. Then, move forward to the end of the available history and apply those changes to create a similar scenario. The new scenario has the same shape and length as the original scenario, but it starts from the current time. This approach is expressed mathematically as:
This equation is computed over the range  to
to  . For the 2019 FRB scenario, this range is January 2019 through March 2021.
If some time passes, then a new time point must be used,  . Assume that the time point is six months later, so is July 2019. Then, apply the original percentage changes to the current data.
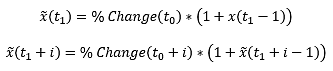
The first month of the scenario,  , is created using the last month of actual data,
  . Then, each successive month of the scenario,
  , extends the previous scenario month,
  .
.
Applying the shift-and-apply-changes approach produces the dashed line in the Closer View of Unemployment Rate Scenarios graph. This modified scenario has the advantage because the scenario and corresponding forecasts change in the same direction as conditions change.