Report Navigation
Report navigation consists of using a combination of slicers, filters, the More Options menu, options available for visuals (tables and graphs), and tabs.
Slicers
Slicers are filters for each report that allow you to narrow or widen the data that appears in the visuals.
Each slicer is one filter. Depending on the available slicers on each report, you can select dates, officers, organizations, products, customers, and/or yield curves.
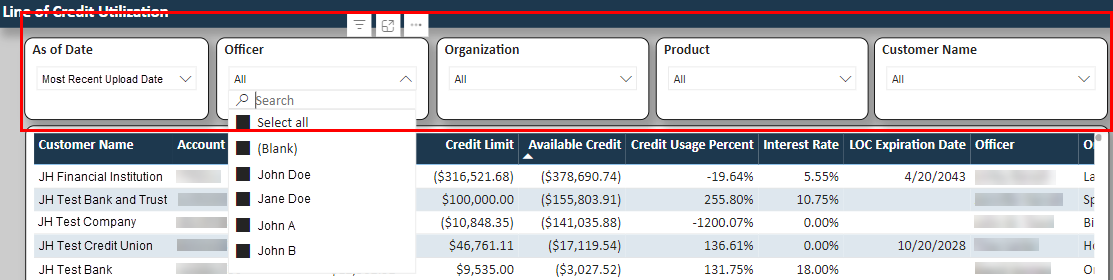
For date ranges, you can enter a date range or you can use the calendar selection to select dates.
For check box drop-down list selections, you can select one option or you can press and hold the Ctrl key to select multiple options. A search field is also available to help you find an option in the list.
The report visuals are updated based on your slicer selections.
Filters
The Filters panel shows you the filters applied to a selected slicer or visual and the filters applied to one or all pages of the report.
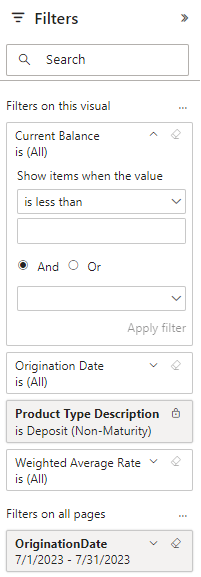
You can hover over a slicer or visual, and then select  Filters and Slicers Affecting This Visual to show the applied filters
in the panel.
Filters and Slicers Affecting This Visual to show the applied filters
in the panel.
To update a filter, you can select or enter options in the filter card, and then select Apply Filter.
If a filter card shows a lock icon, then you cannot update that filter.
Focus Mode
The Focus Mode option is available when you hover over a
slicer or visual, and then select  Focus Mode. The selected slicer or visual opens as its own page in
the report window.
Focus Mode. The selected slicer or visual opens as its own page in
the report window.
You can select Back to Report to return to the full report.
More Options Menu
The More Options menu is available when you hover over a
slicer or visual, and then select  More Options.
Different options are available depending on the slicer or visual:
- Search - Shows or hides the Search field on the slicer.
- Export Data
- Show As a Table - Shows the information for the slicer or visual as a table.
- Spotlight - Highlights the selected slicer or visual.
- Get Insights
- Sort Descending
- Sort Ascending
- Sort By
- Sort Axis
- Sort Legend
Visuals
Visuals are the tables and graphs available on reports. As you select options in slicers and in the Filters panel, the visuals update to show data based on your selections.
If you select a row in a table, then any accompanying graphs update based on your selection. This functionality allows you to widen or narrow the information you are viewing. You can also select a data point in a graph to update the accompanying table based on your selection.
You can select the column headers to sort columns in tables.
You can right-click visuals to see additional menu options. Different options are available depending on the visual:
- Copy - Copies the value or selection to your clipboard.
- Expand and Collapse options
- Show As a Table - Shows the information for the visual as a table.
- Include and Exclude options
- Drill Down and Drill Up options - Allows you to drill down or up by one level of data.
- Drill Through - Allows you to drill into the selected table row or graph data point to view more details.
Tabs
Reports can have multiple tabs that appear across the bottom of the report. Select a tab to view the slicers and visuals related to the tab's title.